How to Read A Spectrum Analyzer
Master the essential tool for mixing and mastering. Learn professional techniques for reading frequency spectrums, identifying resonances, fixing frequency masking, and achieving balanced, commercial-quality mixes.
Master the essential tool for mixing and mastering. Learn professional techniques for reading frequency spectrums, identifying resonances, fixing frequency masking, and achieving balanced, commercial-quality mixes.
The horizontal (X) axis represents frequency, typically from 20 Hz to 20 kHz - the range of human hearing. Lower frequencies (bass) appear on the left, higher frequencies (treble) on the right. Most analyzers offer both linear and logarithmic scales.
The vertical (Y) axis shows amplitude or power of each frequency component, measured in decibels (dB). Taller peaks indicate louder frequencies. Professional mixing typically aims for balanced amplitude across the spectrum without extreme peaks or valleys.
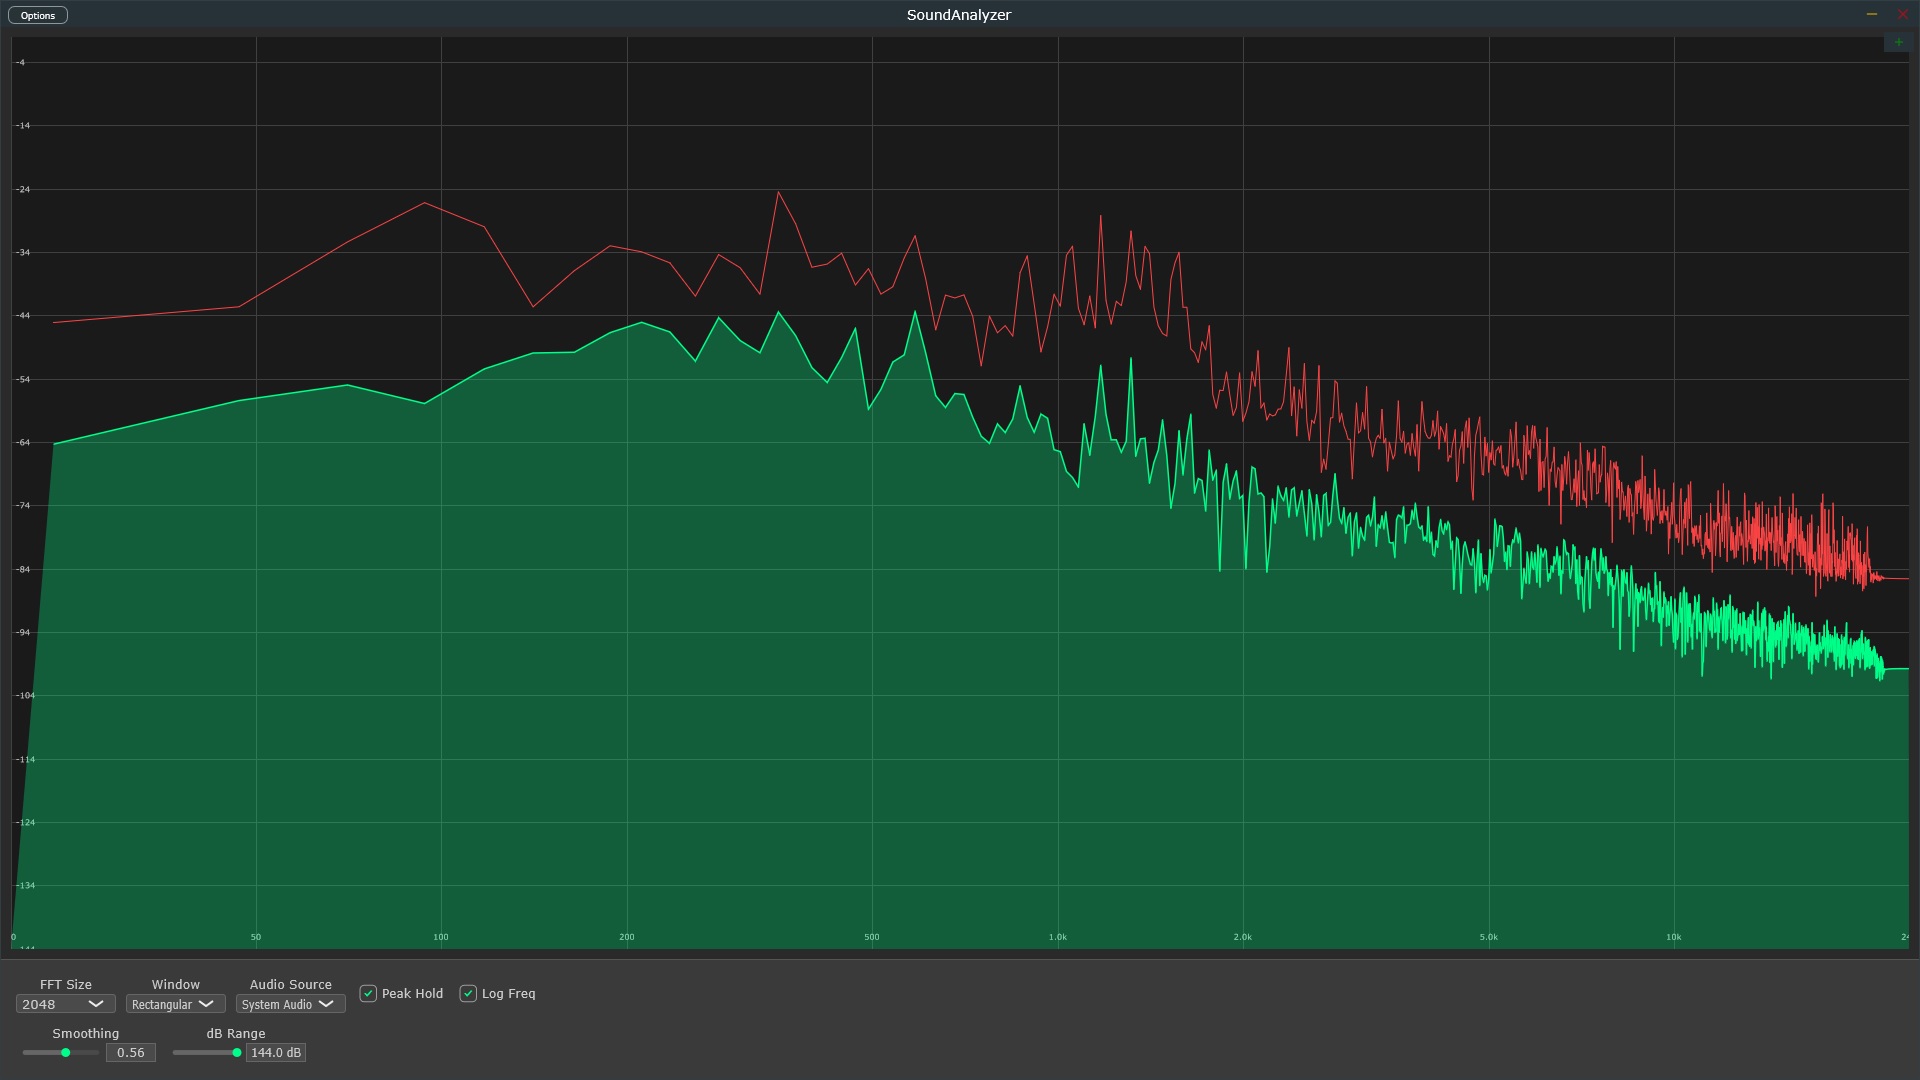
Real-time mode shows instantaneous frequency content - constantly changing with your audio. Peak hold mode captures and displays the maximum amplitude reached at each frequency over time, making it easier to spot resonances and compare levels.
Understanding frequency ranges is crucial for mixing. Each band has specific characteristics and contains different instruments. Here's the professional breakdown used by audio engineers worldwide.
What to Look For: Sharp, narrow peaks in the upper-midrange (2-8 kHz) or broader bumps in low-mids and bass (100-500 Hz).
Why It Matters: Resonances create harsh, unpleasant tones that stick out in your mix.
How to Fix: Use a narrow Q EQ cut at the resonant frequency. Solo the track, sweep an EQ boost to find the harsh spot, then cut it by 2-6 dB.
Pro Tip: Don't rely only on the analyzer - your ears are the final judge.
The Technique: Compare your mix's spectrum to a commercial reference track in the same genre by routing both through your analyzer.
Critical Rule: Never compare static snapshots. Watch how the spectrums behave in real-time during similar sections.
What to Compare: Overall spectral balance, bass-to-treble ratio, midrange density, peak levels in each frequency range.
Warning: Every song is different. Don't try to copy the reference exactly - use it as a guide for general balance.
Low-End Cleanup: Play the track's lowest note/chord. Look for the lowest frequency bump - that's the fundamental. Safely cut everything below it.
Why This Works: Removes rumble, room noise, and mic handling without affecting the actual sound.
Example: If bass guitar's fundamental is 80 Hz, high-pass filter at 40-60 Hz to remove subsonics.
Pro Tip: Don't be aggressive - gentle slopes (12-18 dB/octave) sound more natural than brick-wall filters.
The Problem: When two sounds occupy the same frequency range, they compete and the louder one "masks" the quieter one.
Visual Detection: If bass and kick both peak at 100 Hz, they're fighting. If guitar and vocals both dominate 1-2 kHz, they'll mask each other.
The Solution: Give each element its own sonic space. Cut 80-120 Hz from bass where kick lives. Notch guitars at vocal fundamental (200-400 Hz).
Golden Rule: Each sound should have a clear, definable space in both frequency and stereo field.
The Pink Noise Method: Pink noise has equal energy per octave. A well-balanced mix approximates this curve when viewed on a spectrum analyzer.
What Balanced Looks Like: Gentle downward slope from bass to treble. No extreme peaks or valleys. Energy distributed across the spectrum.
Common Problems: Too much energy in 200-400 Hz (muddy), excessive 2-4 kHz (harsh), weak sub-bass or air frequencies.
Remember: This is a guide, not a rule. Genre matters - EDM has more bass energy, acoustic jazz has more mids.
Real-Time Workflow: Keep your analyzer visible while mixing to catch problems as they develop.
What to Watch: When you add a new element, see where its energy appears. When you EQ, verify you're affecting the intended frequencies.
Processing Verification: Apply compression or saturation and watch how it affects the spectrum. Are you adding harmonics? Taming peaks?
Critical Reminder: The analyzer confirms what your ears hear. If it looks good but sounds bad, trust your ears.
FFT (Fast Fourier Transform) is the algorithm that converts audio into the frequency display. The FFT size dramatically affects what you see and how responsive the analyzer is.
The Trap: Making EQ decisions based solely on what the spectrum looks like, not what you hear.
The Truth: There is no "correct" frequency graph. Each song sounds different, and each graph will be unique. Copying one song's spectrum to another is useless.
Right Approach: Use the analyzer to confirm what your ears hear and to catch problems you might miss, but always make the final judgment with your ears.
The Mistake: Comparing your EDM track's spectrum to an acoustic jazz reference and trying to match it.
Why It's Wrong: Different genres have completely different spectral balances. EDM emphasizes sub-bass and top-end. Acoustic jazz has strong midrange presence.
Correct Method: Only compare to references in the same genre. Study what's normal for that style, then make creative decisions within that context.
The Problem: Taking a screenshot of the reference track's spectrum and trying to make yours match exactly.
Why This Fails: Music is dynamic. The spectrum constantly changes with the arrangement. A snapshot captures one moment, not the whole picture.
Professional Technique: Compare similar sections in real-time (verse to verse, chorus to chorus). Watch how the spectrum moves and breathes.
To apply these techniques, you need a capable spectrum analyzer with proper FFT resolution, configurable settings, and real-time response. Here's what to look for in a professional tool.